Cluster Resampler
This notebook shows how clusterResampler methods are used to create synthetic samples. clusterResampler relies on a Python package k-means-constrained to cluster the data. There are two methods demonstrated in this notebook. The first one draws synthetic values from a multivariate normal distribution. The second one draws synthetic values from a gaussian copula.
[ ]:
from synloc import sample_circulars_xy, clusterCov
Data
[4]:
df = sample_circulars_xy(1000)
df.head()
[4]:
| x | y | |
|---|---|---|
| 0 | -7.439214 | -6.410053 |
| 1 | -16.626527 | -10.295054 |
| 2 | 6.669369 | 19.920039 |
| 3 | 16.274841 | 5.968006 |
| 4 | 7.181718 | -2.006049 |
Using Multivariate Normal Distribution
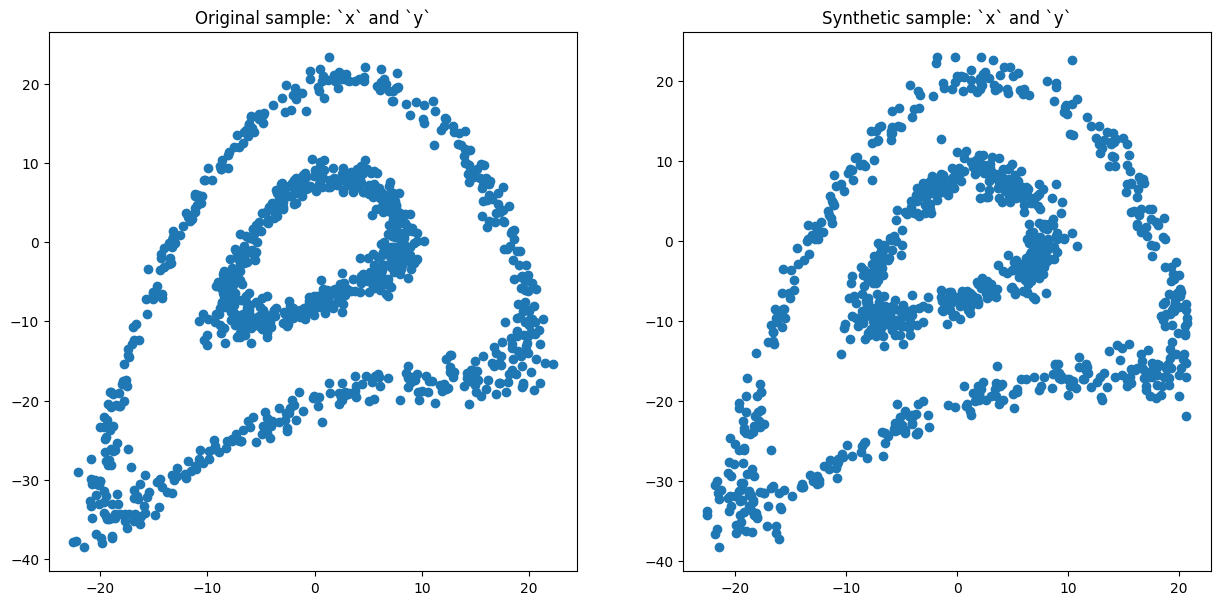
We use clusterCov method to create synthetic data. There are three crucial parameters to define the cluster properties. The first one is the number of clusters, n_cluster. The second and the third ones are the required minimum and maximum cluster sizes respectively. The second and the third ones are optional, however, it is advised to consider the the required minimum cluster size while choosing the resampling method.
[5]:
syn_cov = clusterCov(df, n_clusters=20, size_min=10)
syn_cov.fit()
[5]:
| x | y | |
|---|---|---|
| 0 | -10.447402 | 7.088786 |
| 1 | -4.048904 | 15.440417 |
| 2 | -8.741493 | 9.510548 |
| 3 | -7.061347 | 14.254181 |
| 4 | -5.263386 | 16.549055 |
| ... | ... | ... |
| 31 | -6.509278 | -25.342745 |
| 32 | -4.047308 | -21.856602 |
| 33 | -3.537834 | -23.911015 |
| 34 | -4.728510 | -21.240394 |
| 35 | -3.581509 | -24.209864 |
1000 rows × 2 columns
[6]:
syn_cov.comparePlots(['x', 'y'])