The purpose of this script is to generate a mesh grid within a Polygon. The coordinates of the mesh grid is then used to get elevation data from a public API: api.open-elevation.com. The script can be easly adjusted for other APIs. The output of the script are (1) the coordinates within the polygon and (2) elevations of the coordinates. Data can be used for various purposes. The script can be found in my repository: PolygonElevations. The script file is: PolygonElevations.py
PolygonElevations.Client(polygon, resolution = 100, chunk_size = 50, sleep_time = 0):
polygon: A shapely.geometry.Polygon object.resolution(Integer): he number of grid points in one axes. The number increases at rate resolution^2.chunk_size: the number of elevation points sent to open-elevation.com. Requests for large numbers could be rejected.sleep_time(seconds): If large number of points are required, Open-elevation can block user. sleep_time slows down the data requests.
Requirements
The required Python packages: Pandas, Numpy, Matplotlib, and Shapely.
pip install pandas numpy matplotlib shapely
Initializing
Client must receive a Polygon shape via Polygon object from shapely package:
import pandas as pd
import matplotlib.pyplot as plt
from PolygonElevations import Client
from shapely.geometry import Polygon
Let’s get a Polygon from Istanbul, Turkey:
istanbul = Polygon([(40.986044584788715, 28.935032042041136),
                (41.0572627603291, 28.82871669300217),
                (41.09379592092697, 29.005335537539224),
                (40.996329046194845, 29.095260376068758)])
I initialize my Client:
my_client = Client(istanbul, resolution = 100, chunk_size = 100)
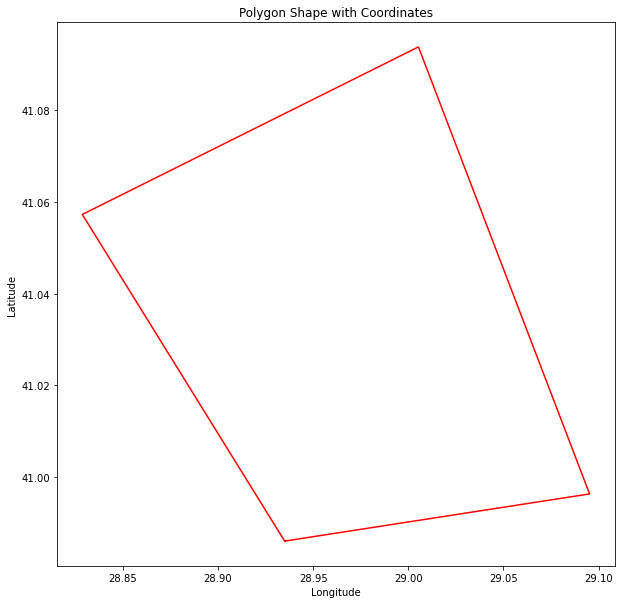
Polygon Shape
my_client.plot_polygon()

plot_polygon() function can take arguments for matplotlib.pyplot.plot. For example:
my_client.plot_polygon(color='red')
Getting Elevation Data
get_data() function retrives elevation points for all coordinates. It returns the first five elements of data points (pandas.DataFrame). The data is saved to Client.data object as pandas.DataFrame.
my_client.get_data()
| latitude | longitude | elevation | |
|---|---|---|---|
| 0 | 40.987133 | 28.933719 | 0 |
| 1 | 40.987133 | 28.936411 | 0 |
| 2 | 40.987133 | 28.939103 | 0 |
| 3 | 40.987133 | 28.941796 | 0 |
| 4 | 40.987133 | 28.944488 | 0 |
Elevation Map
my_client.plot_elevation()

plot_elevation() function can take arguments for matplotlib.pyplot.scatter. For example:
my_client.plot_elevation(marker = 's')
