Hello everyone!
Here is a script I wrote to generate patterns of categorical variables. I was trying to understand the missingness mechanism across various variables. That is why I needed this.
I require the following Python packages:
import pandas as pd
import numpy as np
import matplotlib.pyplot as plt
I randomly generate some integers representing categorical/dummy variables:
n=100
np.random.seed(1)
df = pd.DataFrame([np.random.randint(0,3, n), np.random.randint(0,2, n), np.random.randint(0,3, n)]).T
df.head()
The output looks like this:
| 0 | 1 | 2 | |
|---|---|---|---|
| 0 | 1 | 0 | 1 |
| 1 | 0 | 1 | 2 |
| 2 | 0 | 1 | 1 |
| 3 | 1 | 1 | 1 |
| 4 | 1 | 1 | 0 |
Here is a script that find the frequency of each pattern:
temp_df = df.copy()
patterns = {}
for i in range(temp_df.shape[0]):
    pattern = '-'.join(temp_df.iloc[0,:].values.astype('str'))
    findings = (temp_df== temp_df.iloc[0,:]).all(1)
    patterns[pattern] = findings.sum()
    temp_df = temp_df[findings != True]
    if temp_df.shape[0] < 1:
        break
This function:
- Starts from the first row pattern (
'-'.join(temp_df.iloc[0,:].values.astype('str'))) and finds the similar ones ((temp_df== temp_df.iloc[0,:]).all(1)). - Saves the frequency of the pattern (
findings.sum()) - Drops the rows that has the same pattern countet. (
temp_df = temp_df[findings != True]) - Breaks the loop when all patterns are found.
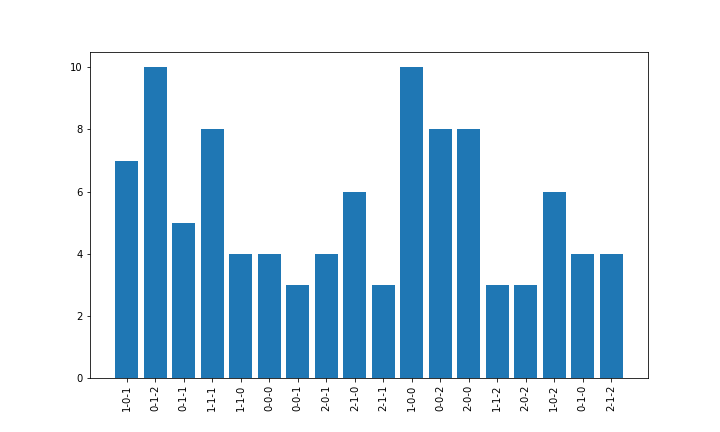
The output looks like that:
plt.figure(figsize=(10,6))
plt.bar(patterns.keys(), patterns.values())
plt.xticks(rotation='vertical')
plt.savefig('patterns.png')