In my research, I needed to use nonparametric sampling methods recently. I needed to draw samples from the distribution of my data. I could not use the classic bootstrapping methods with replacement because I had a small number of observations, e.g. 20. Thus, I estimated the density of my data and draw samples from the estimated probability density function. Here is a simple illustration in R.
Suppose we have the following data generating process:
N.sample = 100 # number of observations in my data
set.seed(111)
U =runif(N.sample) # sample draw from uniform distribution
data = rep(NA,N.sample)

for(i in 1:N){
  if(U[i]<.3){
    data[i] = rnorm(1,1) # with probability 0.3 draw sample from N(1,1)
  }else if(U[i]<.8){
    data[i] = rnorm(1,8) # with probability 0.5 draw sample from N(8,1)
  }else{
    data[i] = rnorm(1,12) # with probability 0.2 draw sample from N(12,1)
  }
}

plot(density(data))
That has the following density:

After estimating the density function, I generated the cumulative distribution function
f.dens = density(data)
cdf.estimate = cumsum(f.dens$y) / cumsum(f.dens$y)[length(f.dens$y)]
# Here I make sure that the last value in CDF is 1.

plot(cdf.estimate, type = 'l', main='Cumulative Distribution')

Now we can draw a sample from the estimated density function:
N.draw = 1000
gen.sample = replicate(N.draw, f.dens$x[findInterval(runif(1), cdf.estimate)+1])
I draw 1000 observations by repeating the function f.dens$x[findInterval(runif(1), cdf.estimate)+1] 1000 times. findInterval(runif(1), cdf.estimate) is a random draw from our CDF that finds the index of the draw. I add 1 to the index because it finds the index value on the left. From f.dens$x[] I find the value of the drawn index.
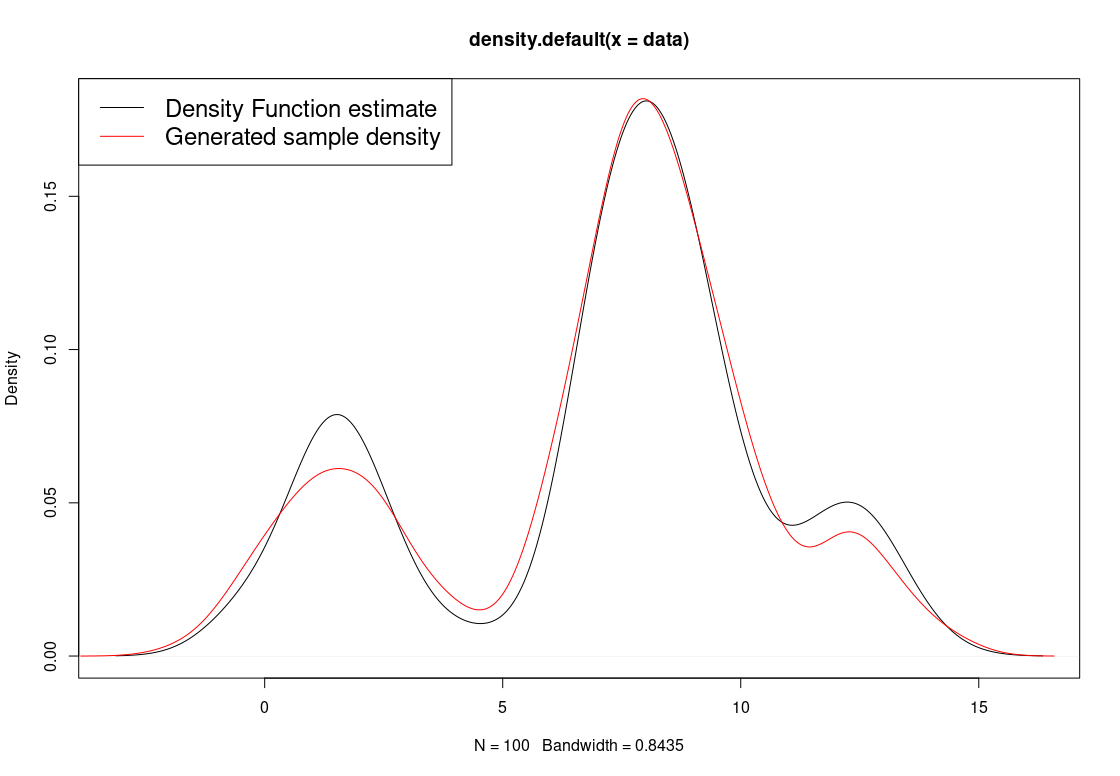
The sample draw density and the first density function looks like as follow:
plot(f.dens)
lines(density(gen.sample),col='red')
legend('topleft',legend=c('Density Function estimate',
                          'Generated sample density'),
       col=c("black", "red"),
       lty=c(1,1),
       cex=1.5)